Employee Net Promoter Score, or eNPS, is a fast way to see whether people would recommend working for an organisation. I use it as a practical signal of engagement: not the whole picture, but a useful one when leadership needs a clear read on sentiment, loyalty and risk. The real value comes from understanding how the score is built, what it can and cannot tell you, and how to act on it without turning the metric into a vanity number.
A simple engagement signal that becomes useful only when you act on it
- eNPS measures how likely employees are to recommend their workplace to others.
- The classic version uses a 0-10 question and groups answers into promoters, passives and detractors.
- The score is calculated by subtracting detractors from promoters, so it can range from -100 to +100.
- In the UK, a median benchmark of 5 gives some context, but your own score should be read against your sector, size and workforce mix.
- eNPS is best used as an early warning signal, then paired with follow-up questions and deeper engagement data.
What eNPS measures and why it matters
eNPS asks one direct question: how likely are you to recommend this company as a place to work? That sounds simple, but it captures a lot in a single response. People usually recommend a workplace when they trust the leadership, feel respected by their manager, see a fair amount of growth, and believe the organisation is worth sticking with.
I like the metric because it gives leaders a quick, repeatable view of employee sentiment. A single score cannot explain every issue in the workplace, but it can tell you whether the overall mood is improving, stalling or slipping. In employee engagement work, that makes eNPS a useful starting point rather than an end point.Once you know what eNPS is measuring, the next step is understanding how that number is produced and why the maths matters.
How the score is calculated
The classic eNPS model uses a 0-10 scale. Responses are split into three groups, and the final score is calculated as the percentage of promoters minus the percentage of detractors. Passives do not directly affect the score, which is one reason the metric is so easy to explain but also easy to oversimplify.
| Group | Score range | What it usually means | Counts in the final score |
|---|---|---|---|
| Promoters | 9-10 | Strong advocates who are willing to recommend the workplace | Yes |
| Passives | 7-8 | Generally satisfied, but not enthusiastic enough to promote the organisation | No |
| Detractors | 0-6 | Employees who are disengaged, frustrated or unlikely to recommend the company | Yes |
For example, if 58% of employees are promoters and 19% are detractors, the eNPS is 39. That is a healthy score, but it still leaves a question open: why are the remaining people not yet strong advocates? I would also treat passives carefully, because they are often the easiest group to move with better management, clearer communication or more visible career development.
Some platforms adapt the method to a 5-point agreement scale instead of the classic 0-10 approach, but the logic stays the same. Use one method consistently, and compare like with like over time. The real question is not just how the score is built, but what a good result looks like in practice.
How to read the number in a UK workplace
There is no universal eNPS target that makes sense for every organisation. In Culture Amp’s January 2026 UK benchmark, the median eNPS score was 5, which is a useful reminder that the baseline in many workplaces is not especially high. That does not mean your business should settle for an average score, but it does mean context matters more than people often admit.
When I interpret the score, I look at it in bands rather than as a single magic number. The broad ranges below are a practical guide, not a law. They help you decide whether the score is mostly a warning, a mixed signal or a sign that things are genuinely working.
| Score band | How I would read it | What to check next |
|---|---|---|
| Below 0 | Negative sentiment is outweighing advocacy | Manager quality, workload, fairness, trust in leadership |
| 0 to 10 | Fragile but not hopeless | Which teams are dragging the score down, and why |
| 10 to 30 | Reasonably healthy, with room to improve | What is keeping people in the middle rather than turning them into promoters |
| 30 to 50 | Strong employee sentiment | Whether the conditions that created it are sustainable |
| Above 50 | Exceptional advocacy | Whether the score is broad-based or driven by a small, highly positive group |
I would not read the number in isolation. A UK office-based team, a frontline operation and a fast-scaling business will not produce the same pattern, even if all three are well run. That is why the next issue is not whether eNPS is useful, but where it helps and where it can mislead you.
Where eNPS helps and where it falls short
eNPS is excellent for tracking direction. It is less useful for diagnosis. If the score drops, you know sentiment has shifted, but you do not yet know whether the cause is workload, pay, line management, internal mobility, poor communication or something more local to one team.
| Metric | Best use | Main limitation |
|---|---|---|
| eNPS | Quick read on advocacy and overall sentiment | Does not explain the reason behind the score |
| Engagement survey | Deeper diagnosis across drivers such as leadership, workload and development | Takes longer to run and analyse |
| Pulse survey | Short-term tracking of a specific issue | Narrow scope if used alone |
In practice, the biggest mistake I see is treating eNPS like a full engagement audit. It is not. A team can be willing to recommend the company and still be frustrated with promotion fairness, inconsistent managers or unclear priorities. SurveyMonkey’s guidance also points out that eNPS should be read in context, because a score that looks acceptable in one industry may be poor in another.
The fix is not to abandon eNPS. It is to pair it with one or two follow-up questions that explain the score. That leads naturally into the part where the metric becomes useful instead of merely interesting.
How to turn the score into action
If I were rolling out eNPS for a UK team, I would keep the process simple and repeatable. Quarterly is a sensible starting point for most organisations, because it gives enough time for change to show up without creating survey fatigue. Monthly can work, but only if the business can respond quickly and visibly.
- Ask the core recommendation question, then add one open follow-up such as "What is the main reason for your score?"
- Segment the results by team, location, tenure and manager, because averages can hide a lot of pain.
- Share the headline result quickly, even if it is not flattering. Silence makes employees assume the score will be ignored.
- Pick one or two root causes, not ten. I have seen many action plans fail because they were broad enough to sound impressive but vague enough to change nothing.
- Assign an owner, set a deadline and re-measure after a realistic interval, usually 60 to 90 days for targeted improvements.
The best follow-up questions are plain and specific. I would usually ask what is driving the score, what would make the employee move up by one point, and which one change would improve their day-to-day experience most. Those answers are more valuable than another neat chart, because they point to behaviour, not just sentiment.
When teams do this well, eNPS becomes a leadership habit rather than an HR report. That is the final distinction I think matters most.
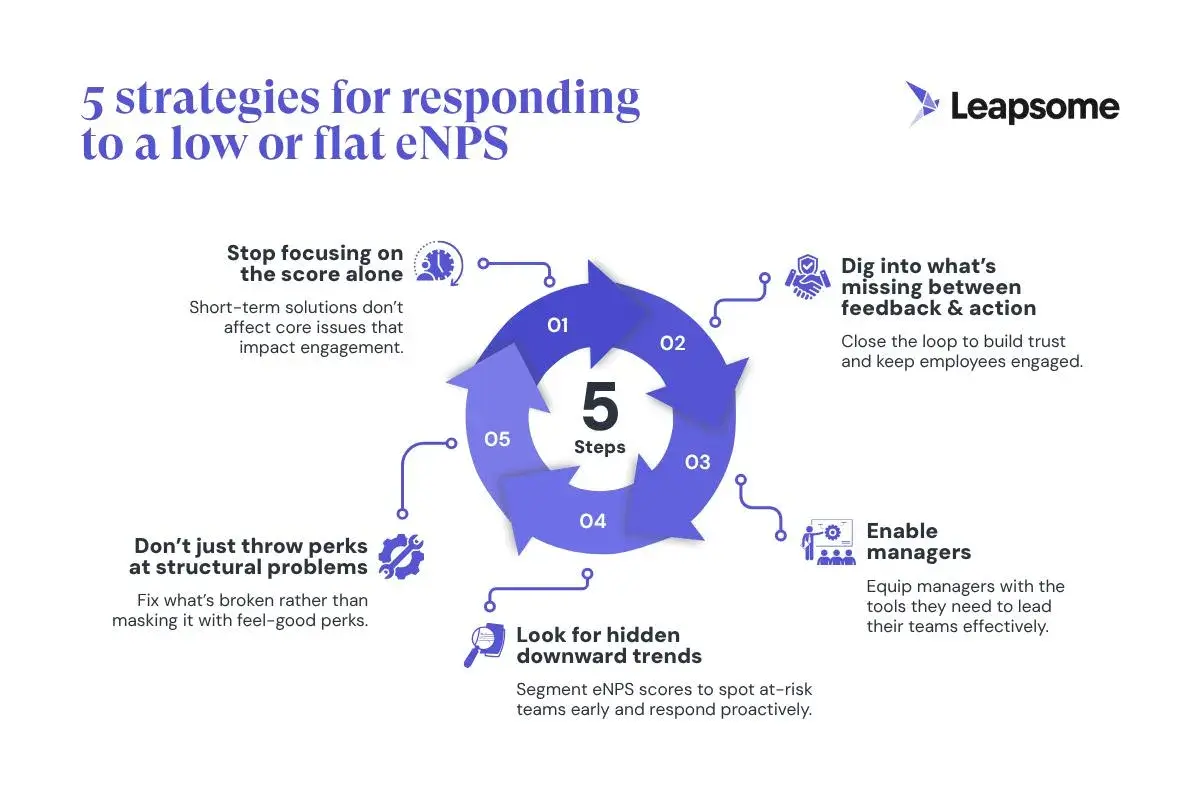
The leadership signal I would act on first
When eNPS is weak, I would not start with perks. I would start with the basics that shape trust: manager consistency, workload, communication and progress. Culture Amp’s January 2026 UK benchmark also shows weaker scores around decision making, work pressure and progress and growth, which matches what I usually see on the ground. People are more willing to recommend a workplace when the day-to-day experience feels fair and manageable.
That is why eNPS is most powerful when leadership uses it as a trigger for conversation, not a finish line. If the score improves, great, but I still want to know what changed in the employee experience. If it falls, I want the team to explain the drop in plain language and act on the cause quickly. The score tells you whether people would recommend the workplace; the follow-up tells you whether they believe the organisation deserves that recommendation.